With the purpose going deeper into some of Bokeh's most advanced features, in this blog entry we will develop a configurable stock chart. Some of the Bokeh features we will be using are glyphs, JS callbacks, and chart legends.
To ease this process we will go over progressively more advanced versions of this chart:
- A basic example that is almost a copy of an example form Bokeh's gallery.
- A more advanced version that shows a legend with the open, close, high, and low prices of the candle we mouse over.
- A final version with configurable indicators.
Although it looks like it, this is not an ipython notebook, if you want the actual notebook, you can get it at github.
from bokeh.io import output_notebook, show
from math import pi
import numpy as np
import pandas as pd
from bokeh.plotting import figure

output_notebook()
1) Let's start with a simple example
The first goal is to create a basic stock chart. The chart will be returned by the function get_stock_chart(df, chart_params), where df is a dataframe with the stock daily price information.
Since this function also needs to know about the colors, size of the chart and anything else, I'll pass this information to the function in a python dictionary chart_params - a structure that is pretty much a json structure.
Ane example of chart_params:
chart_params = {
        "title" : "SPY",
        "colors" : {"up":"Green", "down": "Red"},
        "size" : {"height": 500 ,"width": 1000},
        "days" : 100
}# This function sets the date as the index of this dataframe.
# In case of missing days, it also fills them with nan.
def reset_date_index(df):
df["Date"] = pd.to_datetime(df["Date"])
new_dates = pd.date_range(df.Date.min(), df.Date.max())
df.index = pd.DatetimeIndex(df.Date)
df = df.reindex(new_dates, fill_value=np.nan)
df['Date'] = new_dates
return df
# We will add to this function as we move forward with the example.
# Since this is the most basic example a lot of this code is similar to one of Bokeh's gallery examples.
# See example at http://bokeh.pydata.org/en/latest/docs/gallery/candlestick.html
def get_stock_chart(stock_data, chart_params):
# Reset the date index.
stock_data = reset_date_index(stock_data)
# Only keep the number of days requested in chart_params
stock_data = stock_data.tail(chart_params['days'])
# Make a Bokeh figure
# Bokeh comes with a list of tools that include xpan and crosshair.
# Where pan allows you to move the chart in the y and x axis, the xpan limits this movement to the x-axis.
TOOLS = "xpan,crosshair"
p = figure(x_axis_type='datetime', tools=TOOLS, plot_width=chart_params['size']['width'], plot_height= chart_params['size']['height'], title = chart_params['title'])
p.xaxis.major_label_orientation = pi/4
p.grid.grid_line_alpha=0.3
mids = (stock_data.Open + stock_data.Close)/2
spans = abs(stock_data.Close-stock_data.Open)
inc = stock_data.Close > stock_data.Open
dec = stock_data.Open >= stock_data.Close
half_day_in_ms_width = 12*60*60*1000 # half day in ms
# Bokeh glyphs allows you to draw different types of glyphs on your charts....
# Each candle consists of a rectangle and a segment.
p.segment(stock_data.Date, stock_data.High, stock_data.Date, stock_data.Low, color="black")
# Add the rectangles of the candles going up in price
p.rect(stock_data.Date[inc], mids[inc], half_day_in_ms_width, spans[inc], fill_color=chart_params['colors']['up'], line_color="black")
# Add the rectangles of the candles going down in price
p.rect(stock_data.Date[dec], mids[dec], half_day_in_ms_width, spans[dec], fill_color=chart_params['colors']['down'], line_color="black")
return p
Let's have a look at the df data will be sent to the get_stock_chart function:
# Load the data in the df
df = pd.read_csv("./data/spy.csv", nrows=350)
df.tail(3)
# The chart params allows you to set some of the features of this chart.
chart_params = {
        "title" : "SPY",
        "colors" : {"up":"Green", "down": "Red"},
        "size" : {"height": 500 ,"width": 1000},
        "days" : 100
}

# Get the chart
p=get_stock_chart(df, chart_params)
show(p)

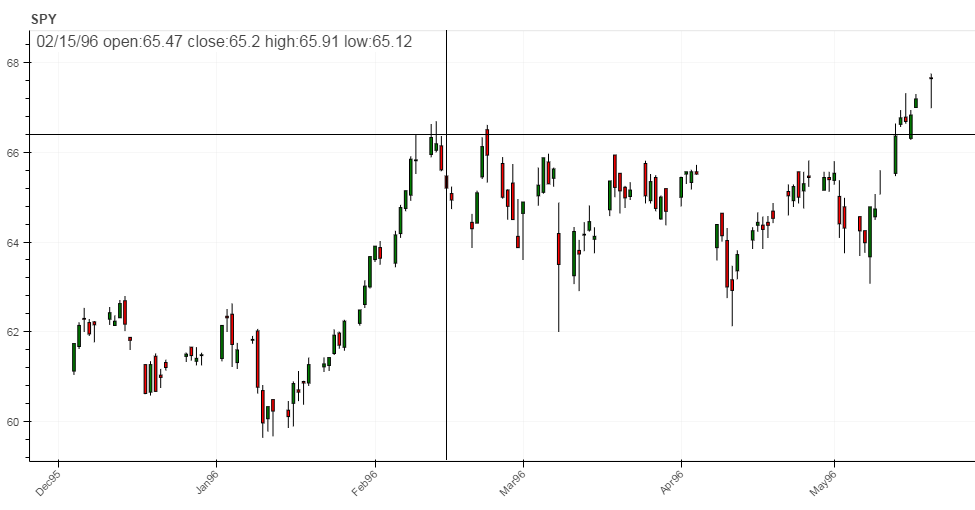
2) Add a legend with information about the candle we are hovering
Now that we have covered the basics, we will add a legend that shows information about the candle we are hovering. Bokeh allows you to integrate javascript callbacks with the charts to respond to the user interactions. In our case, we want to display the price information of the hover-over candle on one of the legends of the chart. One way to pass this information into the JS callback is to make a Python dictionary, which is practically a json structure that can be interpreted by JS.
The stock data dictionary
For this purpose we create a dictionary in the function get_stock_data_dict below. I had to turn the dates into strings so that JS could interpret them.
def get_stock_data_dict(df):
    df['Date'] =  df['Date'].map(lambda x: x.strftime('%m/%d/%y'))
    df = df.fillna(0)
    df = df.set_index(df['Date'])
    df = df.drop('Date', axis = 1)
    df = df.round(2)
    return df.T.to_dict('dict')

# Let's see a couple of entries in this dictionary:
df = pd.read_csv("./data/spy.csv", nrows=2)
df = reset_date_index(df)
dic = get_stock_data_dict(df)
dic
With this data at hand, create the call back and integrate it in out chart:
from bokeh.models import Label
from bokeh.models.formatters import DatetimeTickFormatter
from bokeh.models import HoverTool, CustomJS

def reset_date_index(df):
    df["Date"] = pd.to_datetime(df["Date"])
    new_dates = pd.date_range(df.Date.min(), df.Date.max())
    df.index = pd.DatetimeIndex(df.Date)
    df = df.reindex(new_dates, fill_value=np.nan)
    df['Date'] = new_dates
    return df

def get_stock_chart(stock_data, chart_params):

    # Reset the date index.
    stock_data = reset_date_index(stock_data)

    # Only keep the number of days requested in chart_params
    stock_data = stock_data.tail(chart_params['days'])

    # Make a Bokeh figure
    # Bokeh comes with a list of tools that include xpan and crosshair.
    TOOLS = "xpan,crosshair"
    p = figure(x_axis_type='datetime', tools=TOOLS, plot_width=chart_params['size']['width'], plot_height= chart_params['size']['height'], title = chart_params['title'])
    p.xaxis.major_label_orientation = pi/4
    p.grid.grid_line_alpha=0.3

    mids = (stock_data.Open + stock_data.Close)/2
    spans = abs(stock_data.Close-stock_data.Open)
    inc = stock_data.Close > stock_data.Open
    dec = stock_data.Open >= stock_data.Close
    half_day_in_ms_width = 12*60*60*1000 # half day in

    # Bokeh glyphs allows you to draw different types of glyphs on your charts....
    # Each candle consists of a rectangle and a segment.
    p.segment(stock_data.Date, stock_data.High, stock_data.Date, stock_data.Low, color="black")
    # Add the rectangles of the candles going up in price
    p.rect(stock_data.Date[inc], mids[inc], half_day_in_ms_width, spans[inc], fill_color=chart_params['colors']['up'], line_color="black")
    # Add the rectangles of the candles going down in price
    p.rect(stock_data.Date[dec], mids[dec], half_day_in_ms_width, spans[dec], fill_color=chart_params['colors']['down'], line_color="black")

    ############# ADDING HOVER CALLBACK ############################
    # Create a dictionary that I can pass to the javascript callback
    stock_data_dictio = get_stock_data_dict(stock_data)

    callback_jscode = """
    var stock_dic = %s;         //A string version of the stock_data_dictio will be replaced here
    var day_im_ms = 24*60*60*1000;

    function formatDate(date) {
        var d = new Date(date),
            month = '' + (d.getMonth() + 1),
            day = '' + d.getDate(),
            year = d.getFullYear();
        if (month.length < 2) month = '0' + month;
        if (day.length < 2) day = '0' + day;
        return [ month, day, year.toString().substring(2)].join('/');
    }

     // cb_data.geometry.x provides the x-position of the mouse over the chart.
     // Since the x axis in a datetime type, this number is in number of ms, but it is a float
     // and not so easy to work with, so:
     //        1) I'll turn it into a date
     //        2) Format it into a string (for instance '01/03/95') that I can use it to access the stock_data_dictio

     var d = cb_data.geometry.x;
     try {
      d = Math.floor( d + day_im_ms);
      d = new Date(d);
    } catch(err) {
       d= err;
    }

    // Once I format the date into a string, I can use it as the key to the dictionary
    sel_date = formatDate(d);

    // Using sel_date as the key, add the data from the stock_data_dictio
    date_lbl = sel_date;
    date_lbl = date_lbl + " open:" + stock_dic[sel_date].Open
    date_lbl = date_lbl + " close:" + stock_dic[sel_date].Close
    date_lbl = date_lbl + " high:" + stock_dic[sel_date].High
    date_lbl = date_lbl + " low:" + stock_dic[sel_date].Low
    date_label.text = date_lbl
    """  % stock_data_dictio   # <--- Observe tha dictionary that is to be replaced into the stock_dic variable

    # This label will display the date and price information:
    date_label = Label(x=30, y=chart_params['size']['height']-50, x_units='screen', y_units='screen',
                     text='', render_mode='css',
                     border_line_color='white', border_line_alpha=1.0,
                     background_fill_color='white', background_fill_alpha=1.0)

    date_label.text = ""
    p.add_layout(date_label)

    # When we create the hover callback, we pass the label and the callback code.
    callback = CustomJS(args={'date_label':date_label}, code=callback_jscode)
    p.add_tools(HoverTool(tooltips=None, callback=callback))
    ###################################################################

    return p
df = pd.read_csv("./data/spy.csv", nrows=350)

# Chart params allows you to set some of the features of this chart.
chart_params = {
        "title" : "SPY",
        "colors" : {"up":"Green", "down": "Red"},
        "size" : {"height": 500 ,"width": 1000},
        "days" : 170
}

# Get the chart
p=get_stock_chart(df, chart_params)
show(p)
3) Add Indicators
Another good feature to have in a stock chart is the possibility of showing indicators. For this example I will add just two: a moving average (EMA), and Bolliger bands.
I also want to add a way to configure the indicators through the chart_params parameter:
        "indicators" : [
          {"name":"ema", "period": 14},
          {"name":"bollinger", "period": 14}
]# The indicators are added to the dataframe itself through the functions below.
def ema(df, n):
price = df['Close']
price = price.fillna(method='ffill')
EMA = pd.Series(price.ewm(span = n, min_periods = n - 1).mean(), name = 'EMA_' + str(n))
df = df.join(EMA)
return df
def bollinger(df, n):
price = df['Close']
price = price.fillna(method='ffill')
numsd=2
""" returns average, upper band, and lower band"""
df['bbupper_' + str(n)] = price.ewm(span = n, min_periods = n - 1).mean() + 2 * price.rolling(min_periods=n,window=n,center=False).std()
df['bblower_' + str(n)] = price.ewm(span = n, min_periods = n - 1).mean() - 2 * price.rolling(min_periods=n,window=n,center=False).std()
return df
# Interpret the indicator parameters and add the indicators to the chart:
def add_indicators(indicators_params_list, df, chart):
for indicator_params in indicators_params_list:
if indicator_params['name'] == 'ema':
period = indicator_params['period']
df = ema(df, period)
chart.line(df.Date, df['EMA_' + str(period)], line_dash=(4, 4), color='black', alpha=0.7, legend = 'EMA ' + str(period))
elif indicator_params['name'] == 'bollinger':
period = indicator_params['period']
df = bollinger(df, period)
chart.line(df.Date, df['bbupper_' + str(period)], color='red', alpha=0.7, legend = 'bbupper ' + str(period))
chart.line(df.Date, df['bblower_' + str(period)], color='black', alpha=0.7, legend = 'blower ' + str(period))
return chart
from bokeh.models import Label
from bokeh.models.formatters import DatetimeTickFormatter
from bokeh.models import HoverTool, CustomJS

def reset_date_index(df):
    df["Date"] = pd.to_datetime(df["Date"])
    new_dates = pd.date_range(df.Date.min(), df.Date.max())
    df.index = pd.DatetimeIndex(df.Date)
    df = df.reindex(new_dates, fill_value=np.nan)
    df['Date'] = new_dates
    return df

def get_stock_chart(stock_data, chart_params):

    # Reset the date index.
    stock_data = reset_date_index(stock_data)

    # Only keep the number of days requested in chart_params
    stock_data = stock_data.tail(chart_params['days'])

    # Make a Bokeh figure
    # Bokeh comes with a list of tools that include xpan and crosshair.
    TOOLS = "xpan,crosshair"
    p = figure(x_axis_type='datetime', tools=TOOLS, plot_width=chart_params['size']['width'], plot_height= chart_params['size']['height'], title = chart_params['title'])
    p.xaxis.major_label_orientation = pi/4
    p.grid.grid_line_alpha=0.3

    mids = (stock_data.Open + stock_data.Close)/2
    spans = abs(stock_data.Close-stock_data.Open)
    inc = stock_data.Close > stock_data.Open
    dec = stock_data.Open >= stock_data.Close
    half_day_in_ms_width = 12*60*60*1000 # half day in

    # Bokeh glyphs allows you to draw different types of glyphs on your charts....
    # Each candle consists of a rectangle and a segment.
    p.segment(stock_data.Date, stock_data.High, stock_data.Date, stock_data.Low, color="black")
    # Add the rectangles of the candles going up in price
    p.rect(stock_data.Date[inc], mids[inc], half_day_in_ms_width, spans[inc], fill_color=chart_params['colors']['up'], line_color="black")
    # Add the rectangles of the candles going down in price
    p.rect(stock_data.Date[dec], mids[dec], half_day_in_ms_width, spans[dec], fill_color=chart_params['colors']['down'], line_color="black")

    ############# ADDING INDICATORS ############################
    p = add_indicators(chart_params["indicators"], stock_data, p)

    ############# ADDING HOVER CALLBACK ############################
    # Create a dictionary that I can pass to the javascript callback
    stock_data_dictio = get_stock_data_dict(stock_data)

    callback_jscode = """
    var stock_dic = %s;         //The dictionary will be replaced here
    var day_im_ms = 24*60*60*1000;

    function formatDate(date) {
        var d = new Date(date),
            month = '' + (d.getMonth() + 1),
            day = '' + d.getDate(),
            year = d.getFullYear();
        if (month.length < 2) month = '0' + month;
        if (day.length < 2) day = '0' + day;
        return [ month, day, year.toString().substring(2)].join('/');
    }

     var d = cb_data.geometry.x;
     try {
      d = Math.floor( d + day_im_ms);
      d = new Date(d);
    } catch(err) {
       d= err;
    }

    sel_date = formatDate(d);

    date_lbl = sel_date;
    date_lbl = date_lbl + " open:" + stock_dic[sel_date].Open
    date_lbl = date_lbl + " close:" + stock_dic[sel_date].Close
    date_lbl = date_lbl + " high:" + stock_dic[sel_date].High
    date_lbl = date_lbl + " low:" + stock_dic[sel_date].Low
    date_label.text = date_lbl
    """  % stock_data_dictio   # <--- Observe tha dictionary that is to be replaced into the stock_dic variable

    # This label will display the date and price information:
    date_label = Label(x=30, y=chart_params['size']['height']-50, x_units='screen', y_units='screen',
                     text='', render_mode='css',
                     border_line_color='white', border_line_alpha=1.0,
                     background_fill_color='white', background_fill_alpha=1.0)

    date_label.text = ""
    p.add_layout(date_label)

    # When we create the hover callback, we pass the label and the callback code.
    callback = CustomJS(args={'date_label':date_label}, code=callback_jscode)
    p.add_tools(HoverTool(tooltips=None, callback=callback))
    ###################################################################

    return p
Bokeh accepts colors in RGB format or you can use any of the html named colors
df = pd.read_csv("./data/spy.csv", nrows=350)

chart_params = {
        "title" : "SPY",
        "colors" : {"up":"Green", "down": "Red"},
        "size" : {"height": 500 ,"width": 900},
        "days" : 150,

        "indicators" : [
          {"name":"ema", "period": 14},
          {"name":"ema", "period": 5},
          {"name":"bollinger", "period": 14}
    ]
}


p= get_stock_chart(df, chart_params)

show(p)

Now that we are done with this example, I think it would be nice to take advantage of Python's language and make a nice object oriented version of this functionality. I would like - for instance - to have a way to inject my own indicators as well as a builder pattern to create the chart. I hope I can cover this in another blog entry, or at the very least make it available in github.
We’re going to break down stock trading training for beginners so it doesn’t seem scary. One of the first things you need to do when you start out is to pick a good broker. A stock broker is going to be where you do all your business. Picking one that has large commissions and fees can be detrimental to a beginner.
ReplyDeleteAn important second step is going to be learning how to read a stock chart. The stock chart holds all of the clues to which direction the stock is going to move. Watch our ThinkOrSwim video on charts setup.
Another great resource for learning to read a chart is stockcharts.com. They have a chart school for any questions that you might have. Charts can look like Greek when you’re starting out. The more you look at a chart, the more you’ll understand it and be able to predict trends.
Hey , this is great, thank you!
ReplyDelete